Global and National Greenhouse Gas Emissions
You're about to experience a table that is not very intuitive to use. So for everyone who wants to avoid potential frustration, here is an introduction. Simply scroll down if you want to skip it.
This table lets you dive into global and national greenhouse emissions. Globally we’ve been emitting a lot of greenhouse gases. Together, these emissions are responsible for the (human-induced) global warming. It’s essential we bring these emissions down. Explore who is still emitting what and how much of it with which processes.
Historically, since the year 1750, we (humans) have globally emitted 2935 Gt of CO2, methane and nitrous oxide. The total of global emissions for the year 2022 was 50 Gt. With the current global population that means on average in 2022 we emitted 6.3 tons per person. You can see those numbers in the top of the chart.
In the background of each number you see the little charts showing the historic trends. The colors will be explained next.
Submission for the Posit 2024 table contest.
To be more precise, the unit is in gigatons of CO2 equivalent (Gt CO2e) greenhouse gas emissions, if you want to learn more about the unit go to ClimateChangeTracker.org. Please note that this table doesn’t include emissions from F-gases.
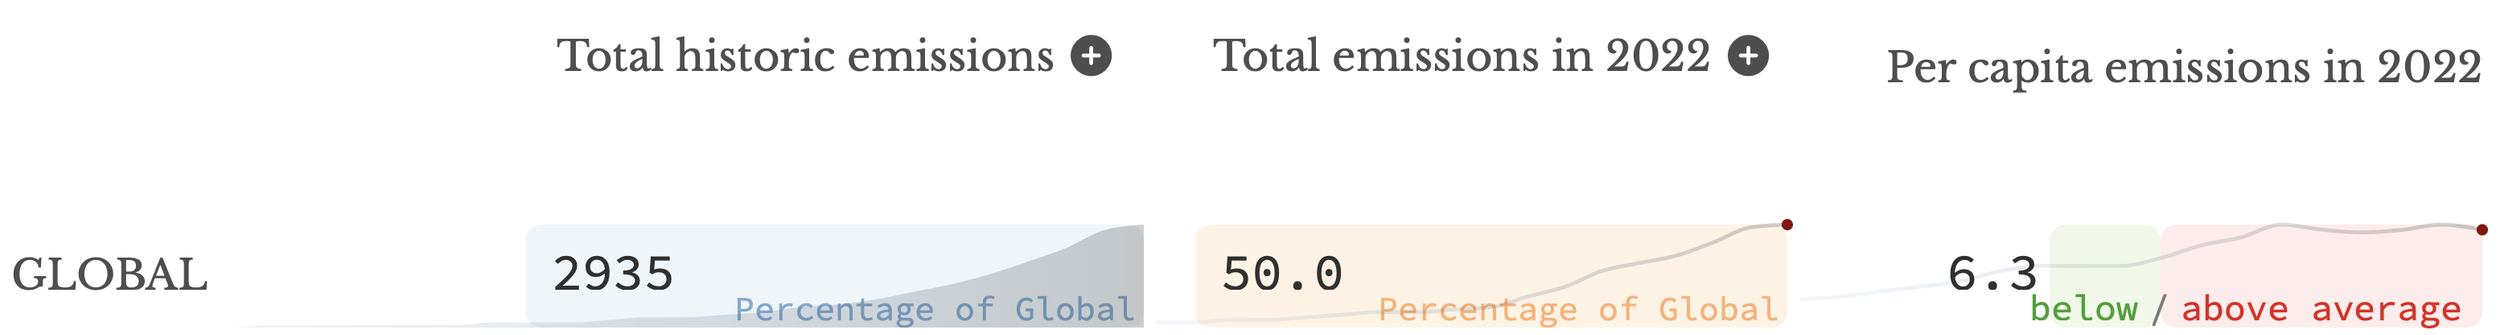
The single nation with the highest historic emissions is the USA with 580 Gt CO2e emissions. That accounts for 20% of the global total, which is the blue shaded color and the reason for ‘Percentage of Global’.
The USA had 6.2 Gt CO2e emissions in 2022, which accounts for 12% of the global total for that year, which you can see in the yellow shaded area.
The per capita emissions for the USA in 2022 are 18.3. That is 12 higher than the global average, which is a lot higher and that’s why the USA receives a large red area. A large red area means way above the global average and a green area means below global average.

China also has high historic emissions at 408 Gt CO2e emissions, 14% of the global total. The 2022 emissions of China are the highest of any country, 13.7 Gt which is good for 27% of the global total.
China does have a huge population and their per capita emissions in 2022 are below the USA, but are still a bit above the global average at 9.5.

As a last single nation example we take India. It also has considerable emissions historically, 148 Gt for 5%, and in 2022 3.6 Gt for 7.1%. However, these numbers are rather low if you take into account the huge population and their per capita emissions are only at 2.5, that’s less than half compared to the global average.

You may have noticed the + symbols on the column headers

When you click them you will get a breakdown of emissions by the 3 greenhouse gases CO2, methane and N2O (nitrous oxide).
Now the colored areas do not represent the percentage of global emissions anymore. Instead they show the percentage per row. So of the 2935 GT Global emissions 68% was CO2, 26% methane and 6% N2O.
Then you can see for example that 78% of USA’s emissions are CO2, 14% methane and7.4% N2O.

You can expand the breakdown further and look for each gas a breakdown of its emissions.
So if we dive into CO2 emissions we can see what part is due to coal, oil, gas, land-use and other sources.
I follow the same grouping as we do at ClimateChangeTracker.org so go there for full explanations.
