
Jiddu Alexander
Data scientist with a theoretical physics background
Make meaningful products and analyses based on a real physical understanding of data.
R programmer specialized in tidyverse and Shiny
Expertly crunch, transform and analyse data. Create highly customizable visualizations and interactive dashboards.
D3.js developer
Unique interactive data visualizations for the web, including immersive scrollytelling data stories.
Freelancer
I'm available for freelance projects, please use the contact form below, LinkedIn or Upwork.
Co-founder Climate Change Tracker
Explore the latest data and insights on climate change.
Scroll to see some of my work


R & Shiny dashboards
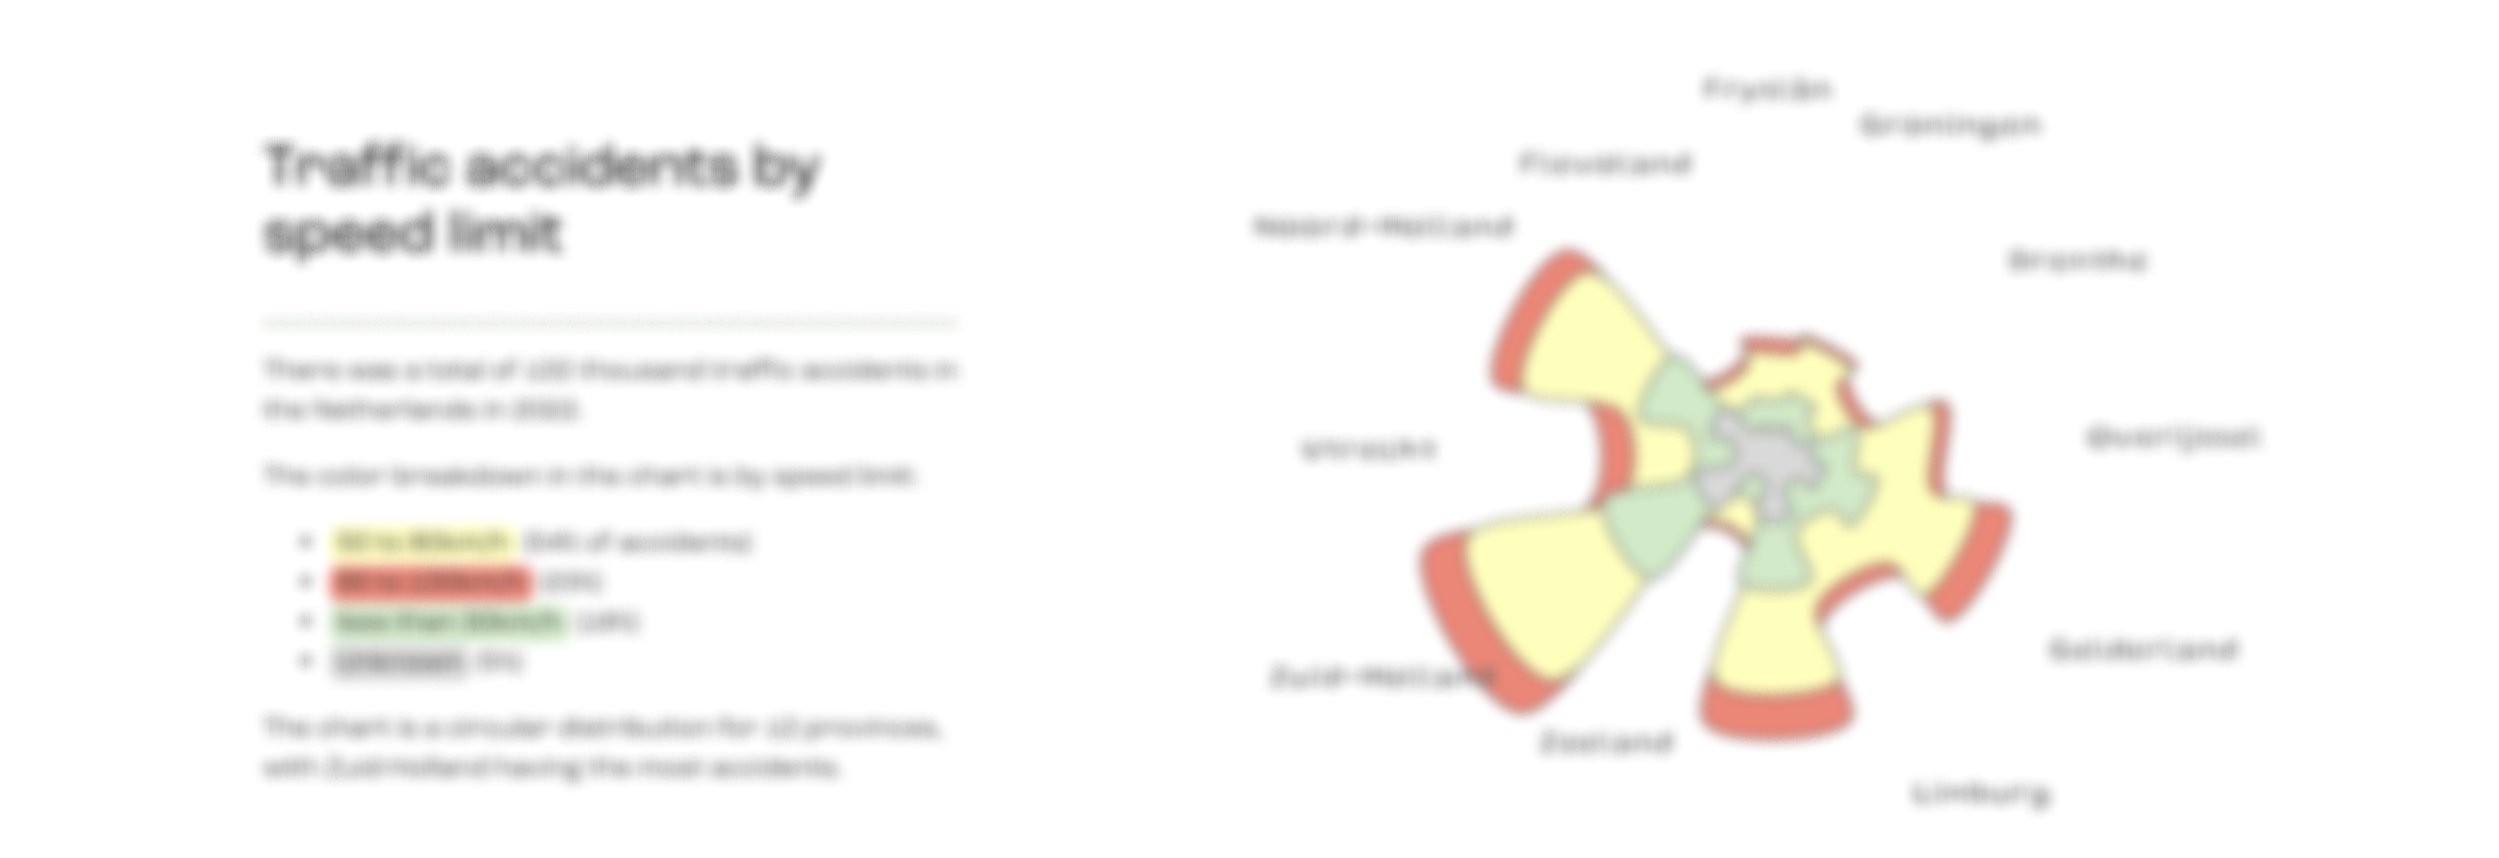
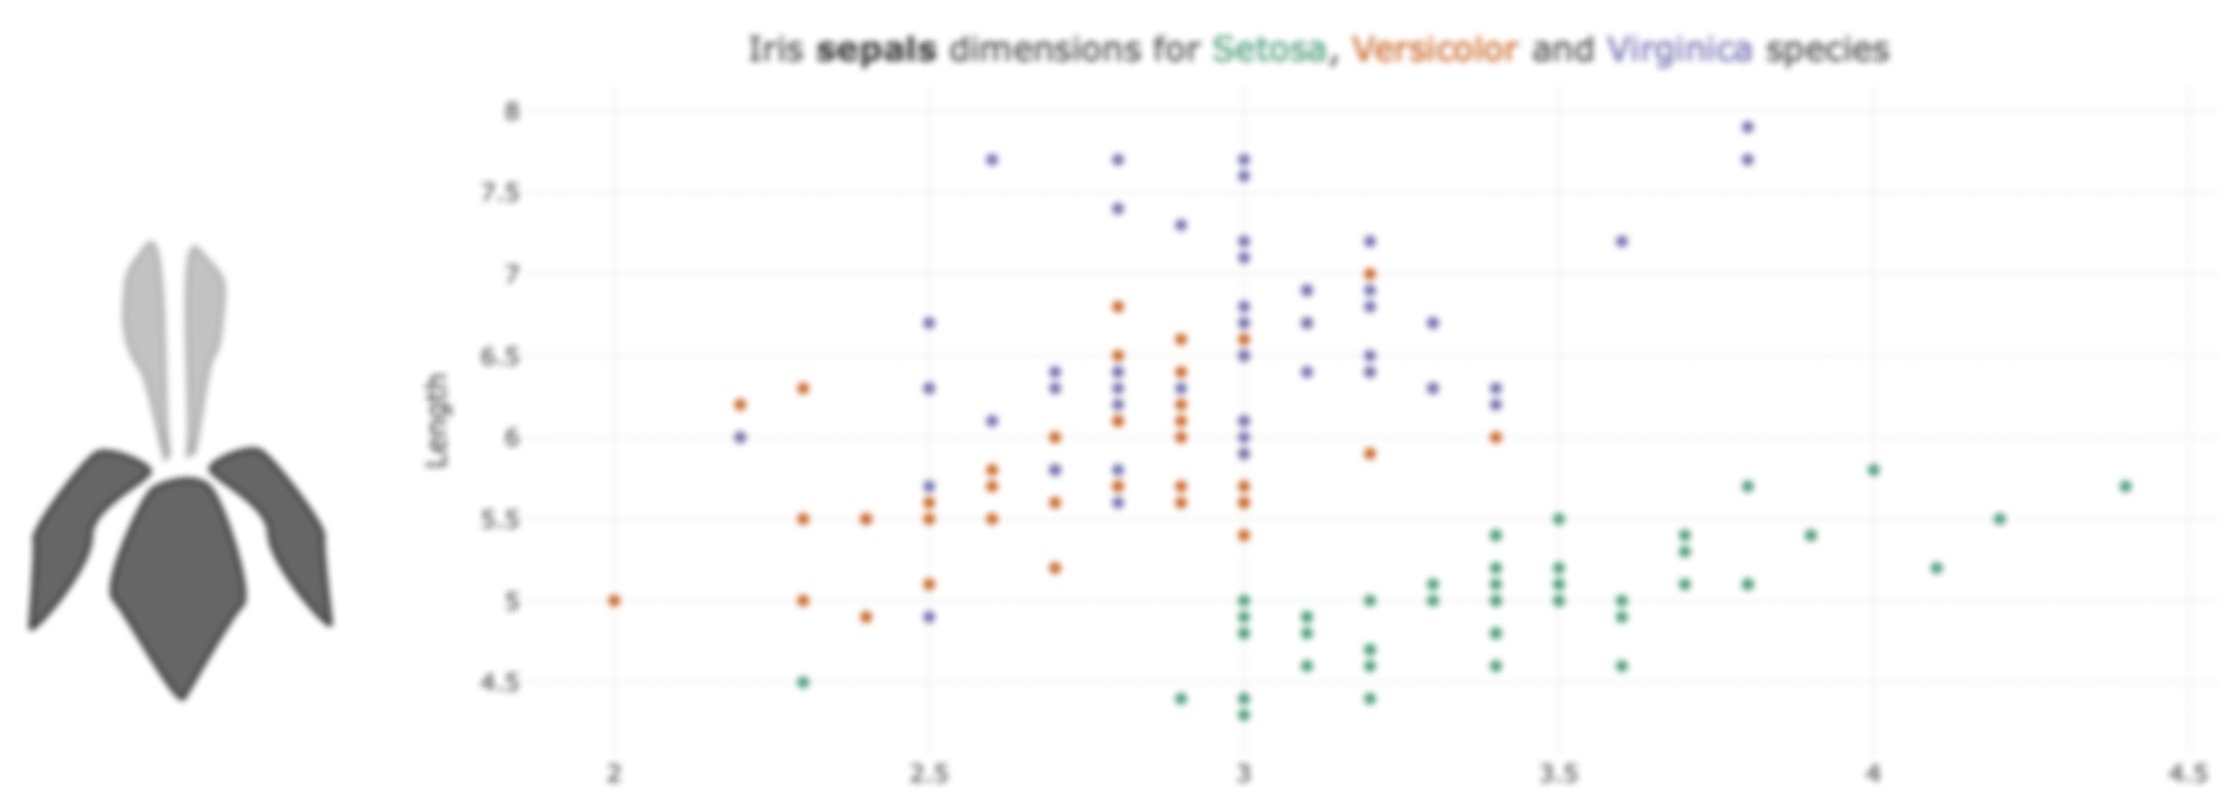
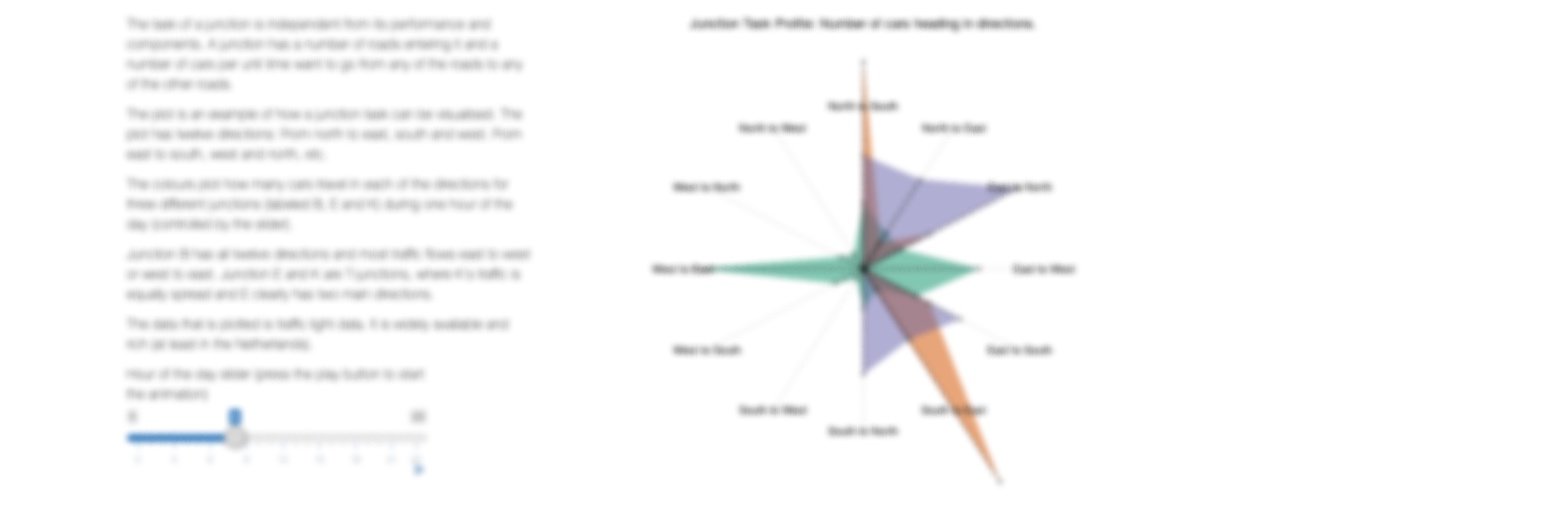
SVG input generator
Create Shiny input functions from your SVGs! Simply upload your SVG, set the input fields and download the scripts for your Shiny app. There are three gallery examples to get inspired.
Runner Up in Posit (RStudio) Shiny contest 2021:
"The judges really loved the functionality and the layout of this app as well as the well-organized code. A very neat tool for all Shiny developers!"


Get in touch
Feel free to get in touch regarding any data science, R programming, Shiny or D3.js development inquiries.